How Much House Can I Afford?
What Are the Most Affordable Cities in the U.S.?
Homebuying can involve a delicate balancing act, with your dream home scenario on one end and your purchasing power and monthly income on the other. It’s a common dilemma: while a significant number of Americans claim they wouldn’t buy if the repayment conditions weren’t amenable, a record 19.7 million homeowners are cost-burdened by their monthly repayments.
This balancing act is one reason the national bank recommends that your mortgage payment alone should “be less than 28% of your current gross income.” The surest way to keep your dreams in check is to figure out what you can comfortably afford before you even start browsing the property listings.
The number of new listings in the U.S. is low right now, while house prices have risen 4.8% year-on-year, affecting the amount of time homes spend on the market and the buyer’s negotiating power. Previously we explored the cost of homes around the world. This time, we looked at homes in the U.S.
To discover the most (and least) affordable cities in the U.S., NetCredit searched publicly available Zillow listings for houses, townhouses and condos/co-ops in America’s 100 biggest cities. Then, we balanced local and national U.S. average household incomes against the U.S. Bank’s threshold for what it considers to be affordable housing payments (28% of monthly income) to calculate the percentage of affordable houses in each city on the local and national average incomes, respectively.
Report Findings
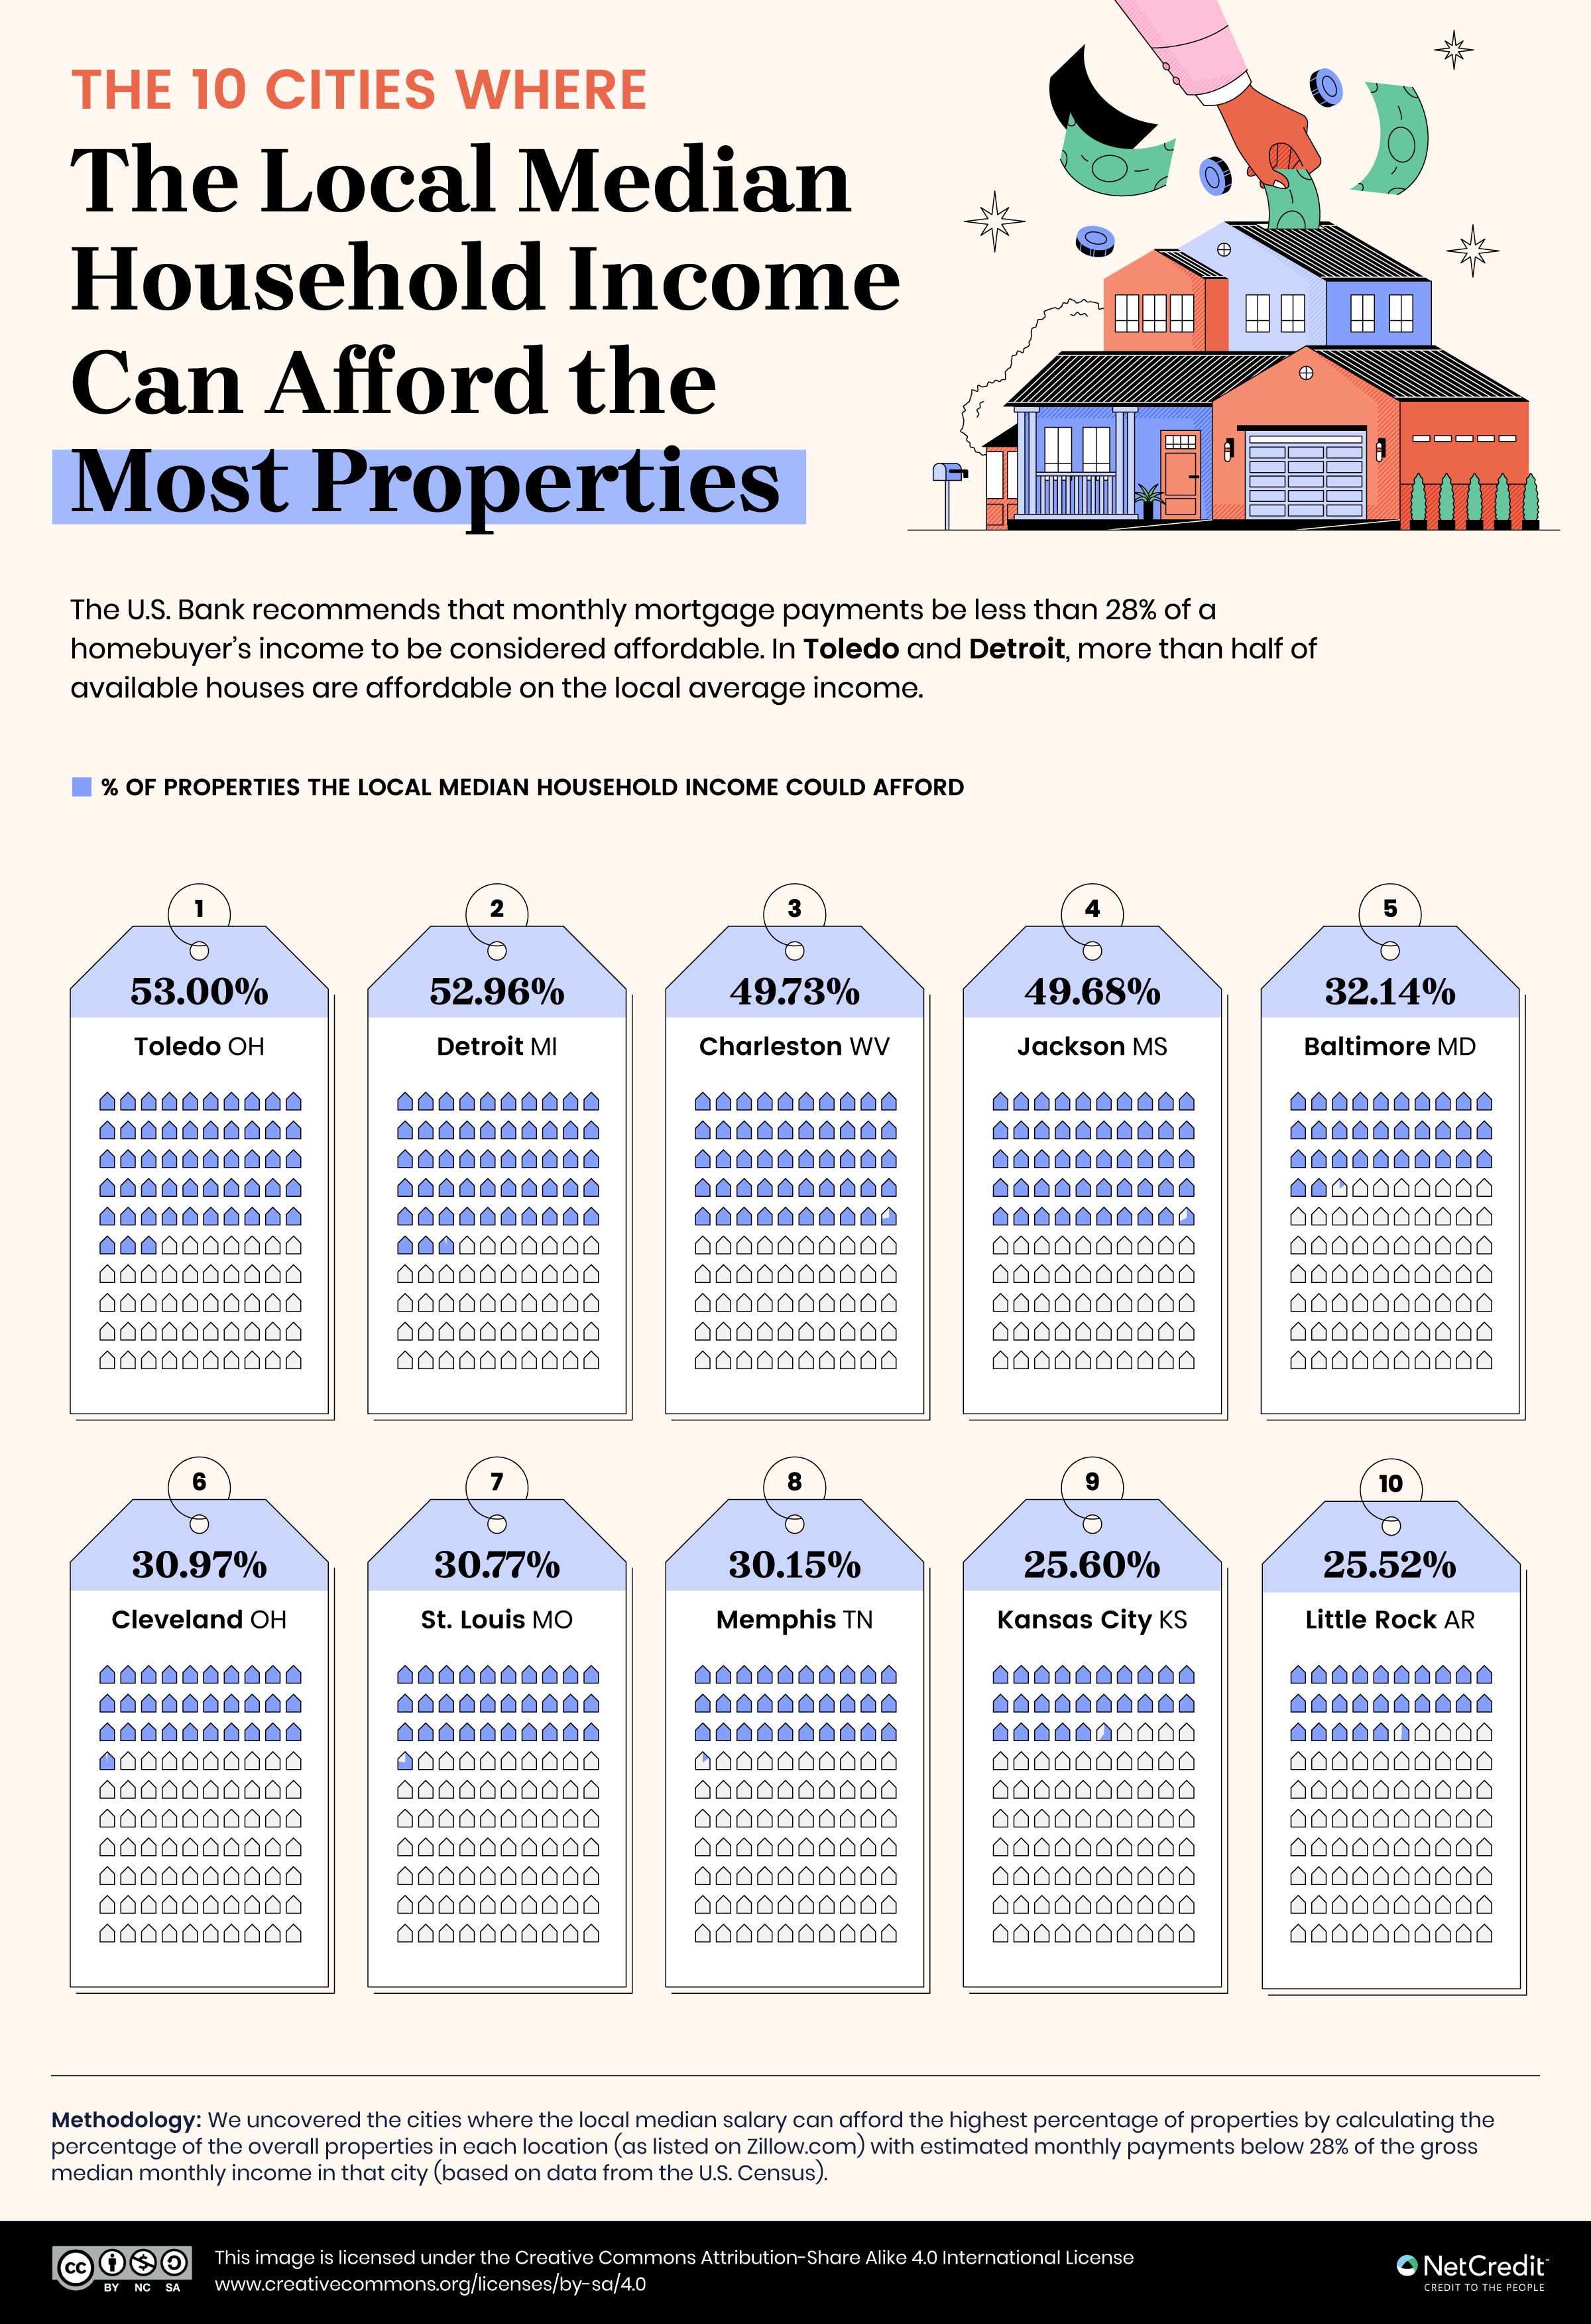
- In Toledo, Ohio, 53.00% of available properties are affordable on the local average income, making it the most affordable big city to buy in America.
- Detroit has the highest percentage of affordable properties on the national average income (77.60%).
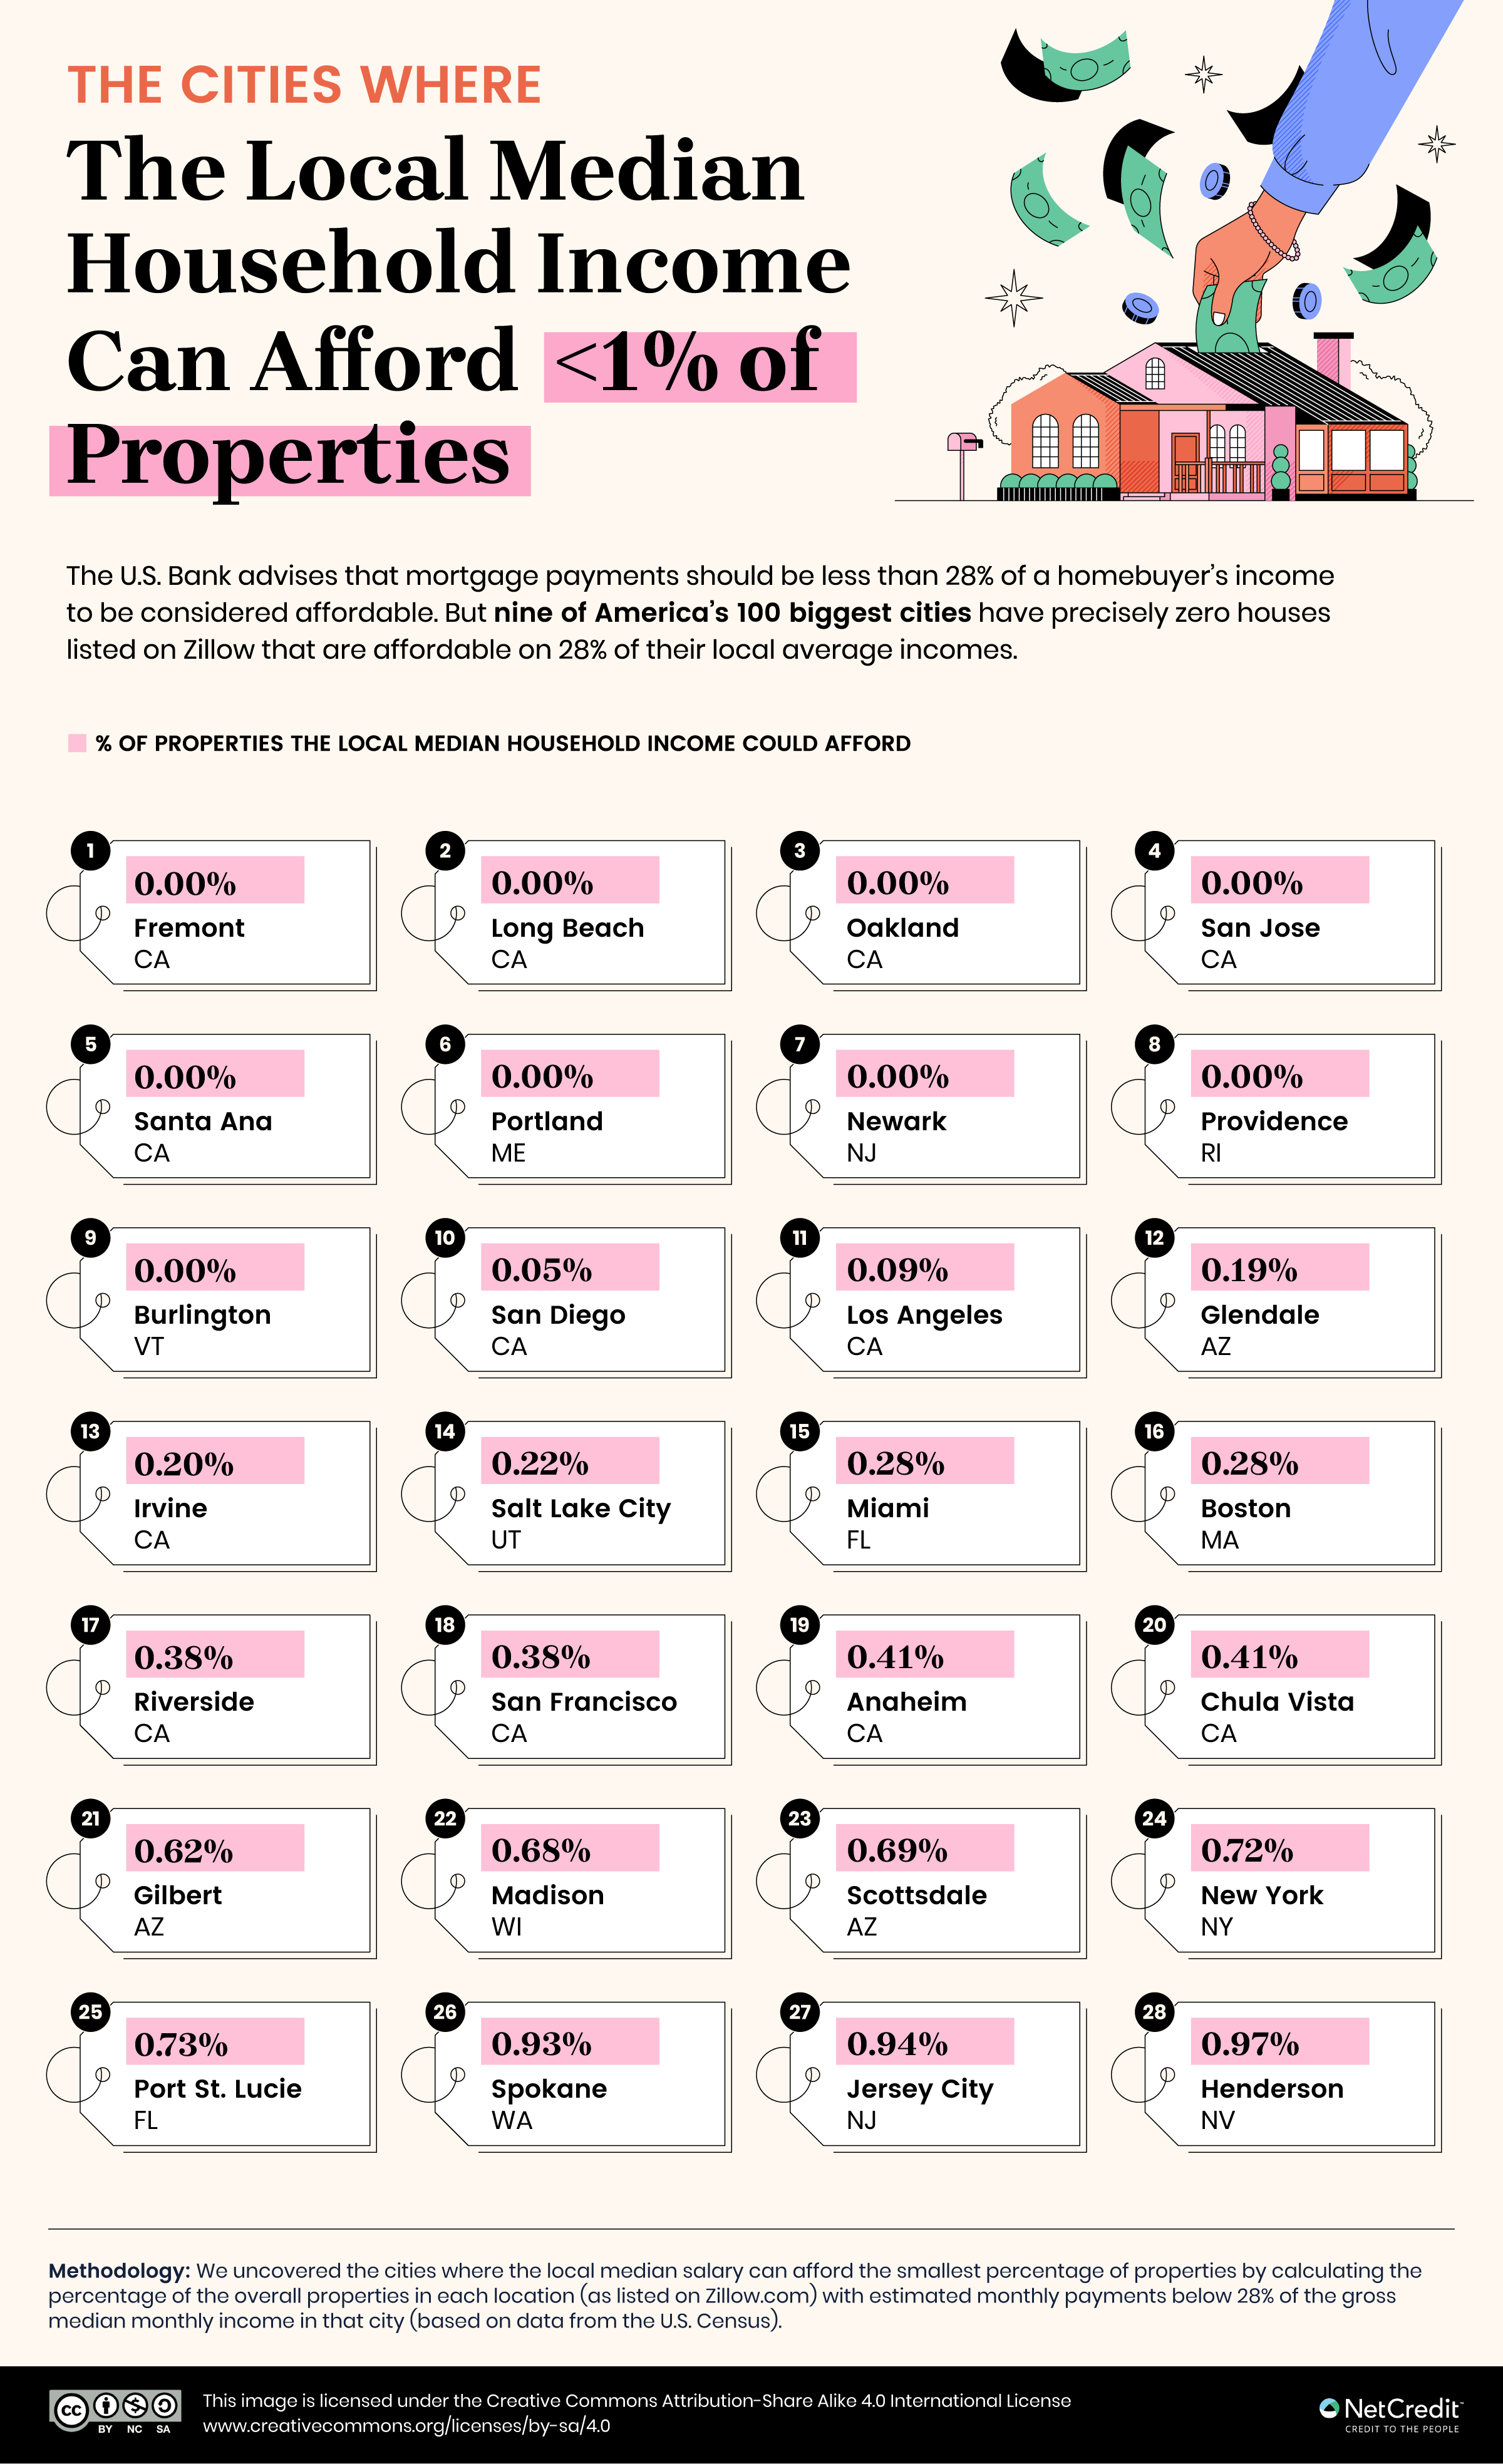
- Nine big cities have zero affordable properties on the local average income, and five of them are in California (Oakland, San Jose, Long Beach, Fremont and Santa Ana).
Toledo Has America’s Highest Proportion of Locally Affordable Homes for Sale
First, we looked at the cities with the highest percentage of affordable properties compared to the local average income. Toledo, Ohio, has the most affordable homes, with 53.00% incurring repayment costs of under 28% of the local average income — in Toledo, this works out at a cap of $1,080 per month. Toledo's population has declined for years, leading to higher housing availability and lower prices. Neighboring Cleveland also makes the top ten, although with a substantially lower 30.97% of properties affordable on the local average income. Down payments on home purchases in Ohio are among the lowest in any state, according to a study by This Old House.

Affordability in Detroit is just a fraction of a percentage lower than in Toledo. In Detroit, 52.96% of homes are affordable on the local average income. Seniors and low-income buyers have benefitted from a $1 billion city investment in affordable housing since 2019. “How we address the housing inequities that will inevitably arise from Detroit’s revitalization will, ultimately, determine if the growth we’re experiencing is sustainable,” says City Council President Mary Sheffield.
The Californian Cities with Zero Affordable Housing
Next, we looked at the big cities with the lowest percentage of available homes below the national bank’s threshold for “affordability.” We found nine cities with zero homes for sale at under 28% of the local average income.
Five of these are in California. Fremont has the highest threshold to reach: at $170,934 per annum, the local average income here is higher than in Oakland, San Jose, Long Beach and Santa Ana. On this income, the average Fremont household must spend more than $3,988 monthly on housing repayments to be considered “cost-burdened.”

Mid-range homes in California cost more than double the price of the average U.S. mid-range home, and buying a two-bed is nearly twice as expensive as renting. The rise in house prices has also outstripped wage growth in California from 2023 to 2024. The price of land, a 25% rise in the cost of building multifamily housing between 2010-2020, and local objections to affordable housing developments have hindered efforts to build new stock that’s truly affordable for Californians.
Compare Local Homebuying Affordability to National Income
Finally, we created an interactive table comparing local house prices with the national average income. By this metric, Detroit leapfrogs Toledo to become the most affordable big city: 77.60% of Detroit homes for sale cost under 28% of the national average income of $74,755. For Toledo, the figure is 74.00%. Use the arrows to sort the data by city, state or percentage of affordable properties.
Among the big cities where no property is affordable on the national average income, eight Californian cities are joined by three in Arizona. Rent in Arizona rose by 72% from 2010 to 2022, while the average house price rose by 57% from 2019 to 2023, according to a report from Arizona State University. A limited groundwater supply and pressures on the local energy grid make Arizona a challenging territory to build new housing stock. Arizona’s climate change challenges are not unique, but they are ahead of the curve, according to Wellington “Duke” Reiter, executive director of the Ten Across project.
“I would say our thesis is this — that if you want to see the future of this country, this is where it's going to happen,” says Reiter. “This is where the growth is. This is where the greatest disparity economically is. It's also the place of greatest demographic change and it's on the front lines of climate change. You take all those factors and you have the recipe for understanding where we're moving and our ability to take on — which is really hard, societally — the knowledge that we have about the future.”
Acumen Before Speculation
The affordability of homes for sale is affected by a range of factors, from salary and job security to local governance and climate change. And all of these are subject to turbulence, which is one more reason why calculating what you have to comfortably spend is something to do early in the process. With another 2% to 6% of your loan amount likely to go on closing costs such as taxes, fees and insurance, it makes sense to balance the books before you even visit Zillow.
Methodology
We started with a seed list of the 100 most populated cities in the U.S. and the most populated by state. Next, we filtered publicly available Zillow listings in those cities by only selecting Houses, Townhouses, Condos and Co-ops.
We recorded the number of available listings with no price filter applied and the number of listings with the 28% threshold applied to calculate the percentage of affordable homes.
We repeated this process using the U.S. median household income ($74,755) to calculate the percentage of homes the typical American household could afford in different cities.
Notes:
- The U.S. Bank considers 28% of gross monthly household income a threshold for affordable housing payments.
- Estimated monthly payments for Zillow assume a downpayment of 20% and include principal, interest, taxes, insurance and HOA fees.
- This data analysis was carried out in October 2024.
DISCLAIMER: This content is for informational purposes only and should not be considered financial, investment, tax or legal advice.


